Sep
Amazon
Buffer Stock Formula: How to Prevent Costly Stockouts with the Right Calculations
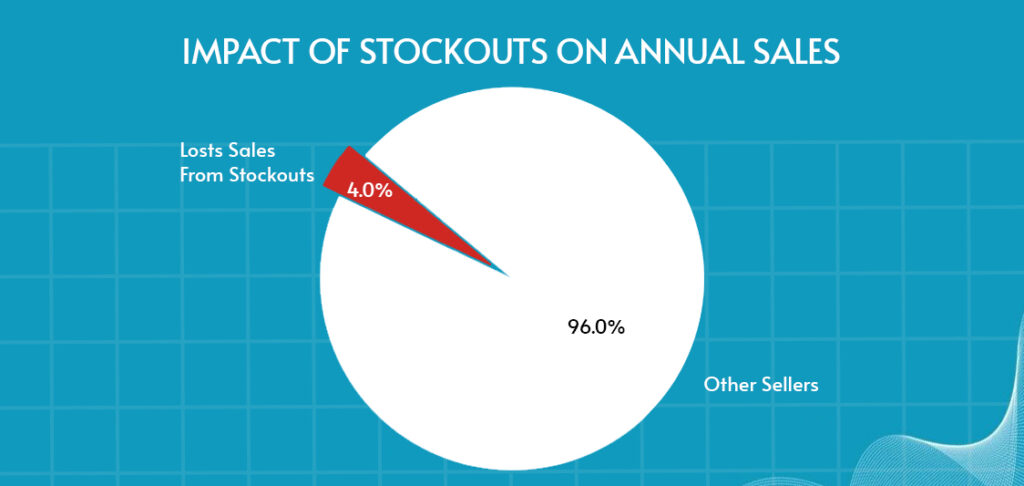
Imagine launching a promotion that drives a surge in orders, only to have customers met with the dreaded “Out of Stock” message. Sales disappear, reviews turn negative, and competitors step in. A single stockout hurts revenue, damages trust, and weakens your market position. In fact, studies show that retailers lose nearly four percent of sales on average every year due to stockouts, and the impact on brand loyalty can be even harder to recover from.
Stockouts happen when demand spikes, suppliers delay, or both. Even the best supply chains need protection, and that is what buffer stock, or safety stock, provides. It is the extra inventory held to absorb the unexpected, and when calculated correctly, it serves as a strategic safeguard for your brand.
In this guide, you will learn the essential concepts, explore both simple and advanced formulas, and understand how to choose the right approach for your business. We will also look at data preparation, cost trade-offs, and why buffer stock should be reviewed regularly. By the end, you will have a clear roadmap to prevent costly stockouts with the right calculations.
Key Definitions & Concepts
Before getting into formulas, it’s important for you to be clear on the key terminologies that are used often in inventory planning:
Buffer Stock
Extra inventory kept on hand as a cushion against uncertainty in demand or supply. It acts as the general safety net to reduce the risk of running out of stock.
Safety Stock
A more precise form of buffer stock, calculated using specific formulas and often tied to a target service level (e.g., 95% in-stock probability). Safety stock is data-driven and ensures a defined probability of avoiding stockouts.
Lead Time
The total time it takes from placing a purchase order with a supplier until the goods arrive and are ready for sale or use. This includes processing, production, and shipping.
Demand Variability
The degree to which customer demand rises or falls from day to day (or week to week). High variability makes demand harder to predict, increasing the risk of stockouts.
Service Level
A measure of how reliably inventory meets customer demand, expressed as a percentage. For example, a 95% service level means customers can expect to find items in stock 95% of the time.
Reorder Point (ROP)
The inventory level at which a new purchase order should be placed to replenish stock before it runs out. The ROP includes both expected demand during lead time and any buffer/safety stock.
Standard Deviation (σ)
A statistical measure that shows how much demand data varies from the average. A higher standard deviation means demand is more unpredictable, requiring more safety stock to maintain service levels.
Basic Buffer Stock Formula(s)
Buffer Stock = (Max Daily Usage × Max Lead Time) − (Average Daily Usage × Average Lead Time)
The most common starting point is the simple buffer stock formula:
Here’s what the terminologies used in this formula means:
- Max Daily Usage: The highest units sold in a single day.
- Max Lead Time: The longest time it has taken for your supplier to deliver.
- Average Daily Usage: Your typical sales per day.
- Average Lead Time: Usual supplier delivery time.
This formula essentially measures the difference between the worst-case demand scenario and the expected demand.
Advanced Statistical Formula
For businesses with fluctuating demand or uncertain lead times, a statistical approach works better:
Safety Stock = Z × σ × √LT
Where:
Z = Service level factor (e.g., 1.65 for 95% confidence)
σ = Standard deviation of demand per period
√LT = Square root of lead time (to account for variability over time)
This formula incorporates both demand uncertainty and your desired risk tolerance.
More Variants
Not all inventory situations can be captured by a single formula. Some advanced models separate variability into two key components:
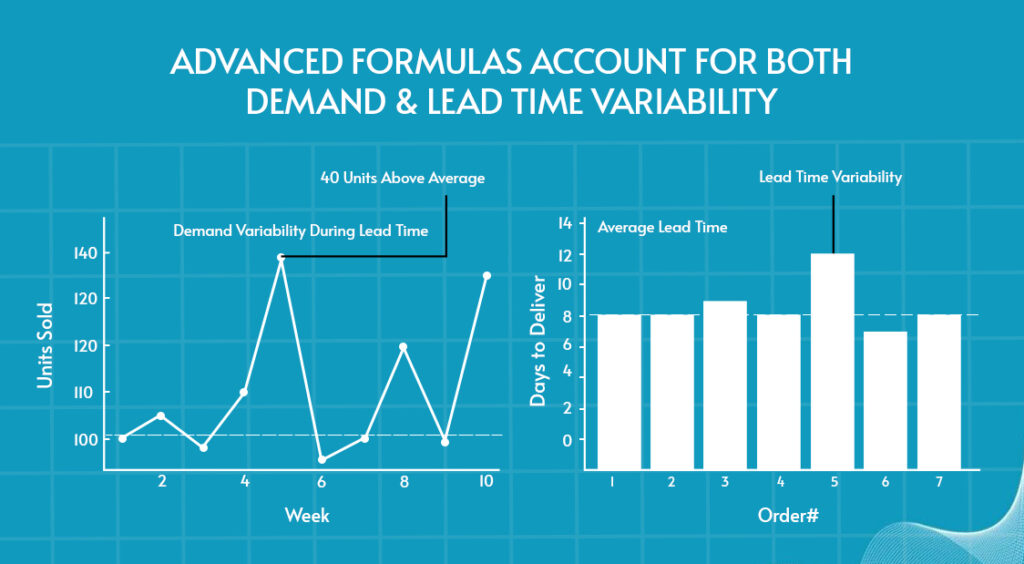
- Demand Variability During Lead Time
This measures how much customer demand can fluctuate while you’re waiting for replenishment. For instance, if your typical weekly sales average around 100 units but occasionally climb as high as 140, that extra 40-unit surge represents the risk gap. To prevent stockouts during those peak weeks, the difference between average and peak demand must be covered by safety stock.
- Lead Time Variability Itself
Even if customer demand remains steady, delays in supplier shipments or transportation can still introduce uncertainty. For example, a supplier might typically deliver in 10 days, but on occasion the shipment stretches to 14 days. Those additional four days of waiting leave your business exposed to stockouts, which means extra buffer stock is needed to cover that extended gap.
By modeling these factors independently, companies can calculate more precise safety stock levels. For instance, some formulas combine the standard deviation of demand with the standard deviation of lead time to capture both risks. This approach is more accurate than treating variability as a single factor, but it requires high-quality, detailed data from both sales and supply chain records.
When to Use Which Buffer Stock Formula
Choosing the right buffer stock formula depends on the stability of your demand, the reliability of your suppliers, and the level of risk your business can tolerate. While simpler methods may be sufficient for predictable markets, more advanced models provide greater accuracy in complex or volatile environments. The table below summarizes when each approach is most appropriate.
| Criteria | Simple Formula | Statistical Formula | Split-Variability Models |
| Best For | Stable environments with predictable demand and reliable suppliers | Volatile demand, frequent supplier delays, or high-stakes / fast-moving SKUs | Situations where both demand and lead time variability matter |
| Inputs Needed | Max/average daily usage + max/average lead time | Demand history (standard deviation), service level target, lead time data | Demand variability + lead time variability (separate calculations) |
| Accuracy | Basic | High | Very High |
| Complexity | Low | Medium–High | High |
| Example Use Case | Commodity product with consistent weekly sales and on-time supplier deliveries | Seasonal fashion items, premium electronics, or FMCGs with unpredictable demand | Complex global supply chains with long transit times and uncertain customer demand |
How to Choose the Right Formula for Your Business
The right buffer stock formula is less about complexity and more about how well it matches your business situation. Consider these factors:
1. Demand Variability
If demand is steady and predictable, a simple formula usually works. But when sales swing sharply, such as during promotions, seasonal peaks, or with trend-driven items, you’ll need a statistical formula that captures variability to avoid stockouts.
2. Lead Time Reliability
Consistent suppliers make planning easier and allow for simpler calculations. If your suppliers often run late, or if goods travel through long global supply chains, factoring in lead time variability is essential to protect availability.
3. Service Level Goals
Your target service level reflects how much risk you’re willing to accept. A luxury or premium brand may aim for 98–99% availability to avoid disappointing customers, while a discount retailer may operate comfortably at 90–92%. Statistical methods let you align safety stock with your chosen service level.
4. Cost Sensitivity
Carrying extra stock ties up cash, eats up warehouse space, and increases the risk of obsolescence. Businesses with tight budgets or perishable goods may opt for leaner buffer levels, while those with higher margins or stricter service expectations can afford to hold more.
5. SKU Criticality
Not every product deserves the same level of protection. High-value, fast-moving, or strategically important SKUs should use more advanced formulas, while slower or low-margin items can rely on simpler approaches.
Start simple, monitor results, and upgrade to statistical or dynamic methods if stockouts or overstock become recurring issues.
Data Collection & Input Preparation
Buffer stock calculations are only as reliable as the data you feed into them. Inaccurate or incomplete inputs will almost always produce misleading results. They either leave you exposed to stockouts or burdened with excess inventory. The goal is to build a clean, consistent dataset that reflects the reality of your demand and supply chain.
What You Need
- Historical Daily Usage: Gather at least 6–12 months of sales data. This timeframe is long enough to capture regular patterns but not so long that outdated trends skew the results.
- Peak Demand Days and Averages: Record your highest-demand days alongside daily averages. These figures help you identify worst-case scenarios compared to typical selling conditions.
- Supplier Lead Time History: Collect both average and maximum lead times. Knowing how long deliveries usually take is important, but knowing how late they can be is crucial for setting realistic safety stock levels.
- Measures of Variability (Standard Deviation): Standard deviation in demand (and sometimes in lead time) shows how much numbers fluctuate from the average, which is the backbone of statistical formulas.
Best Practices for Reliable Data
- Use a Meaningful Timeframe: Too short a period risks being skewed by anomalies; too long may include outdated conditions. A year of data usually strikes the right balance.
- Identify Outliers: Promotions, one-off events, or unusual supplier delays can distort calculations. Decide whether to include or exclude them based on how likely they are to recur.
- Update Regularly: Demand patterns shift with customer behavior, market changes, or product life cycles. Refresh your inputs frequently to ensure calculations reflect current reality.
- Account for Seasonality: Products with strong seasonal trends (toys, fashion, or holiday goods) should be analyzed in segments. Compare holiday seasons to past holiday seasons, not to off-peak months.
- Segment by SKU Type: Treat critical SKUs, perishable goods, or high-value items separately from slower-moving or less risky products. Different items may require different datasets or calculation methods.
- Use Tools: Inventory management systems, ERP platforms, and demand planning software can automate much of this process. They can also flag anomalies, calculate variability, and integrate supplier lead time data for you.
By putting in the work to collect clean, representative data, you lay the foundation for buffer stock formulas that are not only mathematically correct but also practically effective.
Balancing Buffer Stock vs Costs & Risks
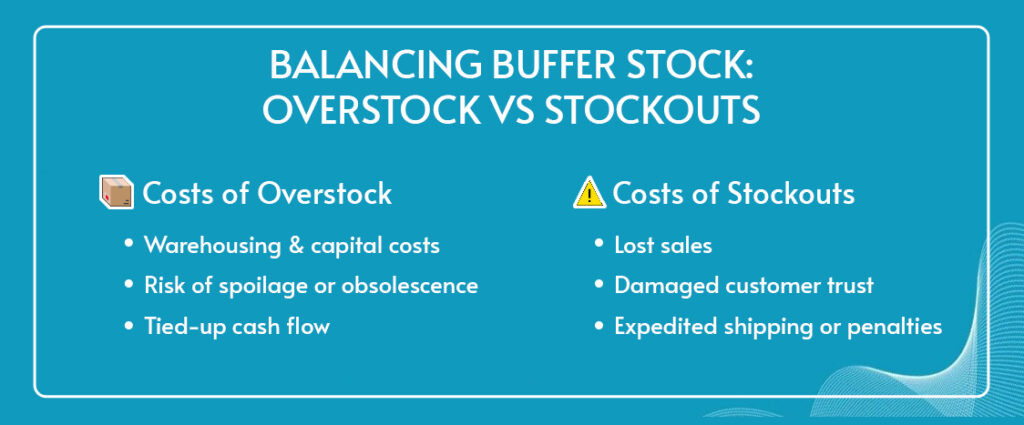
Holding more inventory is the simplest way to reduce the chance of a stockout, but it’s not without trade-offs. Every additional unit you store ties up capital, consumes warehouse space, and increases the risk that products will become obsolete before they’re sold.
The challenge for most businesses is to find the “sweet spot” where you carry just enough safety stock to protect sales without draining cash flow or bloating storage costs.
The Hidden Costs of Carrying Inventory
1. Carrying Costs:
These include warehousing fees, staff time, utilities, insurance, and the risk of damage or spoilage. For some industries, carrying costs can add up to 20–30% of total inventory value each year.
2. Capital Costs:
Money tied up in excess stock is money you can’t spend on marketing campaigns, product development, or other growth initiatives. For startups or businesses operating on tight margins, this opportunity cost is significant.
3. Obsolescence Risk:
Certain products like electronics, fashion, or perishables lose value quickly. Overstocking these items can result in markdowns, waste, or write-offs.
The High Price of Stockouts
While carrying costs are visible and measurable, stockouts often hurt more in the long run:
- Lost Sales: Customers who can’t buy from you may purchase from competitors instead, leading to immediate revenue loss.
- Brand Damage: Frequent “out of stock” messages frustrate customers, lower satisfaction, and can trigger negative reviews. On marketplaces like Amazon, this can also harm your search rankings.
- Operational Penalties: Stockouts can force costly fixes, such as rush shipping, air freight, or expediting supplier orders. For sellers on platforms, running out of stock may also reduce Buy Box share or impact performance metrics.
Smart Strategies to Manage the Balance
Instead of simply “stocking more,” businesses can apply targeted strategies to manage risk without tying up too much capital:
1. Prioritize SKUs:
Assign higher safety stock levels to fast-moving, high-margin, or strategically critical products, while keeping leaner coverage for slow-moving or low-value items.
2. Diversify Supply:
Use multiple suppliers, backup vendors, or regional warehouses to reduce reliance on a single source and shorten lead times.
3. Forecast Smarter:
Adopt demand forecasting tools that incorporate historical data, seasonality, and promotional impacts to predict spikes more accurately.
4. Tier Service Levels:
Not all products require the same level of protection. For example, flagship SKUs may justify a 98% service level, while accessories or secondary products can function at 90–92%.
5. Lean Inventory Practices:
Use just-in-time (JIT) principles where feasible, or consider vendor-managed inventory (VMI) to reduce your own carrying costs.
Dynamic Buffer Stock / Review & Adjustment
One of the biggest mistakes businesses make is treating buffer stock as a “set it and forget it” calculation. Demand shifts, suppliers change, and new risks emerge.
When to Review:
- If buffer stock is frequently used.
- When lead times shift (supplier delays or improvements)
- During or after promotions, seasonal changes, or product launches.
How to Adjust:
- Use moving averages or rolling standard deviation.
- Create alert thresholds (e.g., if safety stock is consumed more than twice in a quarter).
- Track KPIs like stockout frequency, order fill rate, and buffer usage.
Modern dashboards and ERP systems can automate much of this monitoring and flag when recalibration is needed.
Conclusion
Buffer stock formulas are not just math, they’re insurance against costly disruptions. By understanding the core concepts, choosing the right formula for your situation, and feeding calculations with clean, current data, you can reduce the risk of stockouts without overloading your shelves.
The key is balance: enough buffer to meet your service levels and protect your brand, but not so much that it drains your resources. Make buffer stock a living number, review it, refine it, and adjust it as conditions change.
Another option is to outsource the inventory management to any of the reliable 3P services. If you are looking for a reliable one, Prime Retail Solution is the one. We have been managing the inventories, marketing, and scaling of the brands for years. So, book a free consultation call right now to discuss your business.
FAQs
1. What is the difference between buffer stock and safety stock?
Buffer stock is a general cushion of extra inventory kept to handle uncertainty in demand or supply. Safety stock is a more precise, data-driven version of buffer stock, often tied to a target service level (e.g., 95% in-stock probability).
2. How do I know which buffer stock formula to use?
If your demand and supplier lead times are stable, a simple formula works well. For volatile demand, seasonal peaks, or unreliable suppliers, use a statistical or split-variability formula that accounts for both demand and lead time fluctuations.
3. How much historical data do I need to calculate buffer stock accurately?
Ideally, 6–12 months of daily usage and lead time data is recommended. This captures regular demand cycles and provides enough depth to calculate averages, peaks, and variability.
4. How often should I review and adjust my buffer stock levels?
Buffer stock should be reviewed regularly, especially after promotions, seasonal changes, supplier performance shifts, or when stockouts occur more frequently. Treat it as a dynamic number, not a fixed one.
5. What’s the biggest mistake businesses make with buffer stock?
The most common mistake is over-relying on a one-time calculation. Businesses either tie up too much cash in excess inventory or run out because they fail to update formulas with fresh demand and lead time data.
Share